Graphs
Recently, I’ve been thinking a lot about newsletters. I’ve been reading a lot of newsletters and reading about a lot of newsletters, but most of all I’ve been thinking about them.
Both Anna Weiner’s article for the New Yorker and Clio Chang’s special report for the CJR describe how popular newsletter service Substack is hard to classify as it morphs into “not-a-media-company”; failing the duck test.
Robin Rendle’s visual essay questions what we might have lost as the early internet drifted into today’s internet of apps. It’s an arresting view, expertly delivered through a slow-web guided essay.
I was surprised by the combative tone of this interview with one of the Substack co-founders — reading this pre-empted this companion article in warning of the imminent danger from lack of moderation.
And I found myself regretfully agreeing with this guest post’s severe suggestion that newsletters, mostly found and published daily on Substack and promoted via leadership boards, lead to homogenous content and a violation of a “Social Fog of War”.
In the end, I figure none of these above hot takes matter. The best thing about newsletters is how they allow you to turn down the incessant noise of the internet and strip it all back to a short (or long) conversation between a writer and their readers.
The keynote from Vicki Boykis at rstudio::conf upon this:
One of the recurring themes of Normcore Tech, my newsletter, has been that, even though we all sit at machines and write code or munge data for a great deal of the day, we ultimately crave human connection. We don’t have a way to create and handoff physical things. Cultivating our own garden online that’s not subject to variations online … can be a way to give us that satisfaction.
See you last year

When I started writing source/target—around this time last year—I wasn’t sure of much. I wasn’t sure if it was something I would stick with. I wasn’t sure of how often I would write it. I wasn’t sure the topics I would cover. I wasn’t sure if anyone would even read it!
One thing I’m sure of now is that the original idea of “news about graphs” turned out to be not that which I’m interested in writing about. This isn’t news, I said as much back in edition #14. There are loads of other places you could go to scratch that itch.
In earlier editions I spent a large amount of time thinking about “why” graphs and networks are interesting. I tried to sneak up on the topic; looking to discover a new perspective on their appeal and understand why I even wanted to write the newsletter.
The friends rules we made along the way
Twenty-five editions later and I feel much more comfortable about my topic of choice. It turns out source/target isn’t really about the graphs and networks. It’s not about the ways they’re implemented or stored. It’s not even about the way they’re visualized. It’s clear now that source/target is about the world around graphs and how we grapple with the connections around us.
Three “unofficial rules of source/target” have bubbled up over the last year:
1. Keep it positive
I’m a sarcastic person who decided early on that I wanted to keep source/target and takeaways as positive as possible.
This may seem “safe” or “boring” at times but I’m not looking to spark any viral beefs.
2. Do the reading
There’s an infinite stream of content out there on the internet. I don’t want to add to the firehose by copy-pasting any link with a tangental connection to graphs and networks.
Everything I share in source/target has been read, digested and sparked interest for me in some way.
3. Keep it unusual
Corporations are people too. Like people, this doesn’t mean that everything they say is necessarily interesting. It’s easy to say “everything is a graph” or “everything is connected” but digging a little deeper is much more rewarding.
With source/target I want to share projects and content from individuals from around the world that show a spark of curiosity fanned by graphs and visualization.
I could wait a year, but I shouldn’t wait three
With all that reflection out of the way I want to set the tone for source/target for 2021 and beyond. I want source/target to exist in the gaps between a variety of topics:
- graph analysis
- graph drawing & theory
- graph & data visualization
- network science
- social network analysis
As a fail-safe to the “Substack milquetoast” I think the breadth and depth of these topics are set to be the strength of source/target in the future.
Feedback, support & survey
I’d love to hear what you think, feel free to hit reply and let me know. I’ve put together a short, anonymous survey to make the feedback process as easy as possible.
Oh and for the 5% of you who want to hear more from me on writing the newsletter and related projects you can now support source/target here.
As ever, thank you for reading – see you in two weeks.
Links
- A beautiful interactive Map of Mathematics from Quanta Magazine.
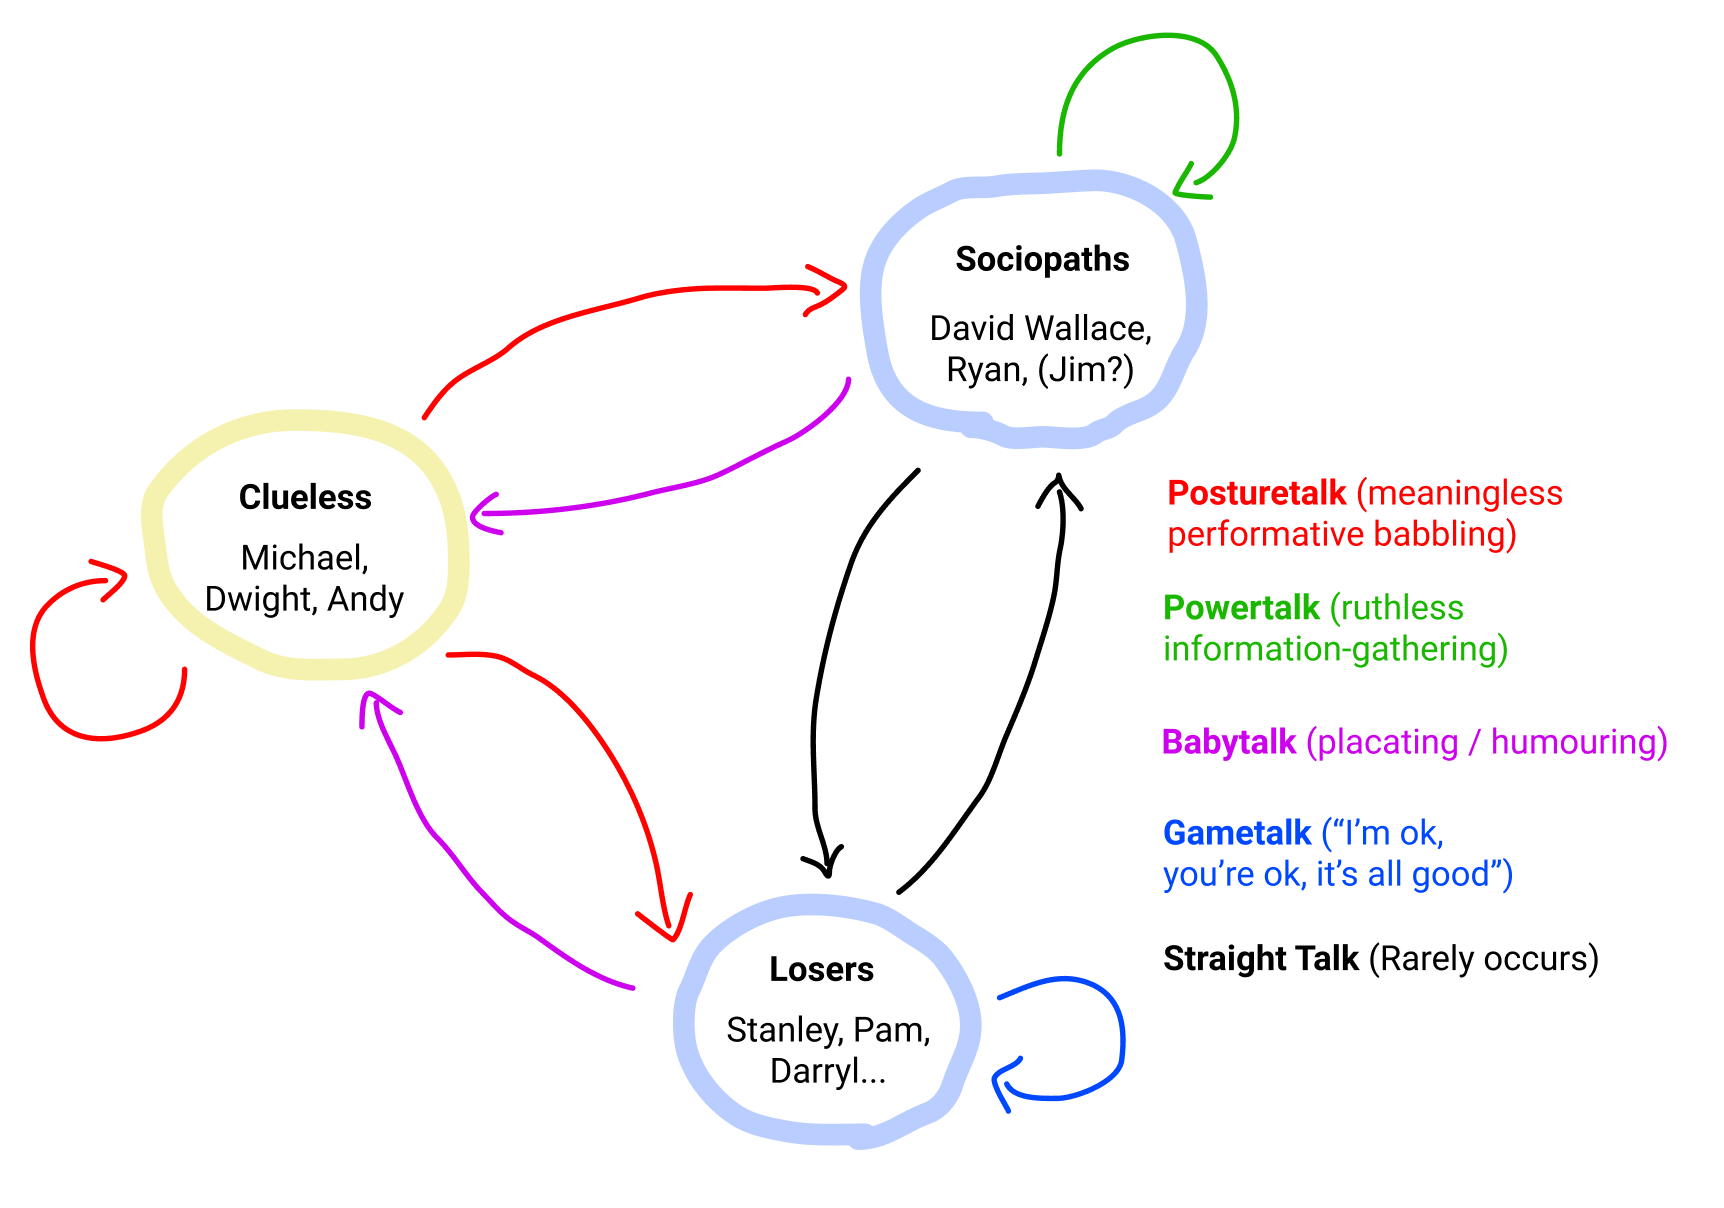
- An article from Alex Danco entitled “The Michael Scott Theory of Social Class” is doing the rounds in 80% of the sites and newsletters I read. It’s effectively a rephrased subset of Venkatesh G. Rao’s “The Gervais Principle” but I love the state diagram showing the interactions between the “Clueless”, the “Sociopaths” and the “Losers.”
Two podcasts this week:
- NETfrix – a Network Science Podcast from Asaf Shapira
- A Spanish-language (for now) podcast about Social Network Analysis called Knitting Networks from Francisca Ortiz Ruiz & Alejandro Espinosa-Rada.
Okay, okay, I don’t speak Spanish so I just broke rule #2. The podcast looks great though!
Nodes
What’s the difference between envy and jealousy? I wondered this recently and was surprised to find the answer in The Simpsons, of all places.
Homer Simpson: I’m not jealous, I’m envious. Jealousy is when you worry someone will take what you have. Envy is wanting what someone else has.
Another resource I found was this endearingly-2006 site on Emotional Competency which includes the following helpful map.

What about spite? The map above shows how jealousy could lead to anger via insult but what about the case — as with spite — where harm is caused without any benefit to the perpetrator.
Take so called “spite houses”, “building[s] constructed or substantially modified to irritate neighbors or any party with land stakes”
The closest obvious example of these to me is The “Sam Kee Building” in Vancouver which is The Guinness Book of Records’ “shallowest commercial building” in the world:
The unusual proportions arose from a dispute whereby the City had expropriated most of the lot for street-widening without compensating the owner, the Sam Kee Company, for the residue, believed to be unusable.
This event has value as a gauge of the disrespect shown to Chinese-Canadians by the civic authorities; and owner Chang Toy’s response in building on the much-reduced site is an indicator of the Chinese community’s defiance to this discrimination.

A recent paper from Nature models spite as a dynamic network where a subset of the network is given spiteful characteristics. They found, per Northeastern that:
spiteful agents targeted non-spiteful players, draining their resources so the spiteful agents looked better in comparison.
This resulted in the initially non-spiteful agents realizing they were worse off and perpetuating the spite to get ahead. Researchers found that it continued to spread until there were no cooperative players left.
“Spite is contagious” is a dour takeaway but, hey, now we know.

I stumbled upon this graph data art from Brendan Dawes in 2016. It’s a graph visualization for Cancer Research UK showing collaboration between scientists fighting to beat cancer globally. Used as a cover for a research journal it’s an uplifting use of visualization that offers an antidote to all that spite.
If you’ve read this far you should take 5 minutes to fill out this short survey on source/target – help me shape the future of source/target.